Last updated:
 Why Trust Cryptonews
Ad Disclosure
We believe in full transparency with our readers. Some of our content includes affiliate links, and we may earn a commission through these partnerships.

With today’s 4.27% price lapse, the Solana price finds itself at a critical juncture as it retests crucial supports to its uptrend so far. Losing which, stands to derail bullish end-of-year projections for the front-running altcoin.
These levels mark a potential turning point from the 4.01% loss over the past week, highlighting a crucial moment for reinstating Solana’s path to a new all-time high.
Particularly amidst elevated trader activity, with trading volume surging 154% to $9.62 billion over the past 24 hours, increased volatility stands to bolster Solana’s next move.
Bitcoin Dip Sparks Liquidation Landslide
Bitcoin’s sudden dip to $94,000 sparked market-wide volatility, with increased supply pressure triggering over $1.6 billion in liquidation over a 24-hour window, according to coinglass data.

The event marks the biggest since 2021. While the short side has lost only $154.6 million, the majority of the losses stem from long-side optimistic traders.
This ongoing pullback is assumed to be a long squeeze, as heightened optimism led to highly leveraged positions being liquidated.
Solana Price Analysis: Is $300 Next?
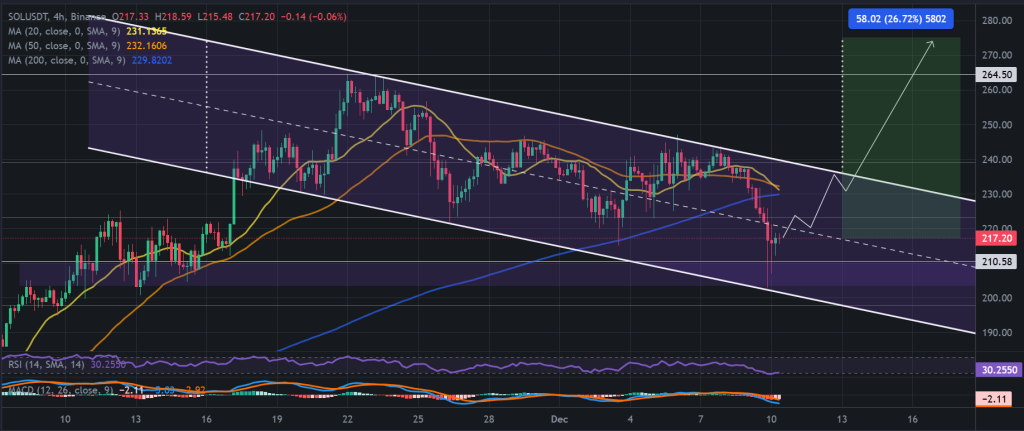
The recent downtrend appears poised to come to a head as the Solana price holds strong following a test of a critical support juncture.

The altcoin seems to have made a decisive bounce from the lower support of a descending channel pattern forming since its last high. This bounce not only affirms the pattern’s integrity but also solidifies a support zone between $210.58 and $203.56.
This strong backing makes a reversal credible, eyeing an advance towards a retest of the pattern’s upper boundary next. Even more so, the Relative Strength Index (RSI) stint in oversold territory lends to a bullish correction.
Given the Solana price finds the momentum for a bullish breakout of the pattern, it would set a price target around $275, though the uptrend could well continue towards the $300 mark.
Disclaimer: Crypto is a high-risk asset class. This article is provided for informational purposes and does not constitute investment advice. You could lose all of your capital.


